User story #924

Burn down chart data display
Status:
New
Priority:
Normal
Category:
-
Target version:
-
Blocked:
Alone:
Milestones:
Sprint:
Description
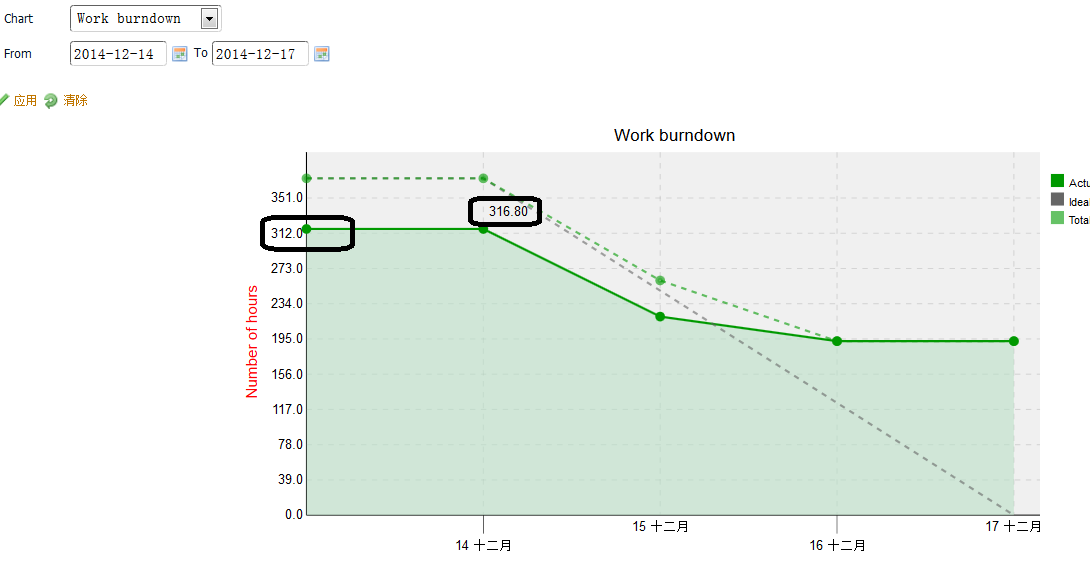
As a user, I want to see burndown chart with day by day in the sprint, and the graph can show data of pending effor and estimated effort when clicking or near to the point, not only the curve, like the attachment effect.
Files
 Updated by an li over 11 years ago
I think adding this feature is necessary to get each day's effort precise value from the chart.
When move mouse button to the point of pending effort and estimated effort in the curve, there wil display the value like the attachment picture.