Forums » Problems or support »
 Sprint BurnDown chart
Added by Guillermo Lasprilla about 11 years ago
Hi,
Is there anyone experiencing some problems with the sprint burndown graph?
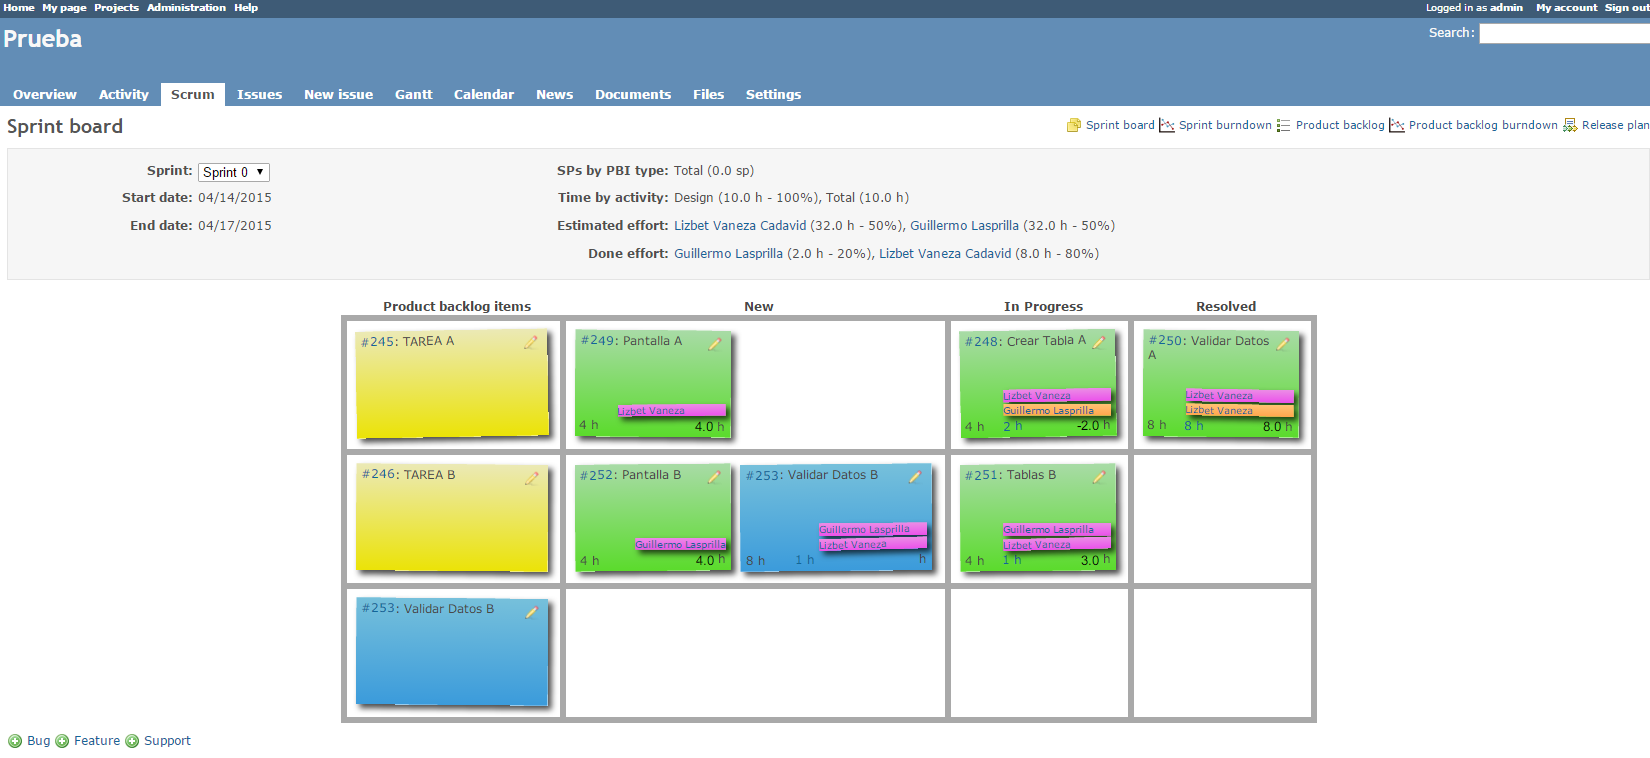
I've added 2 developers to the spint tasks as you can see on image RM1.
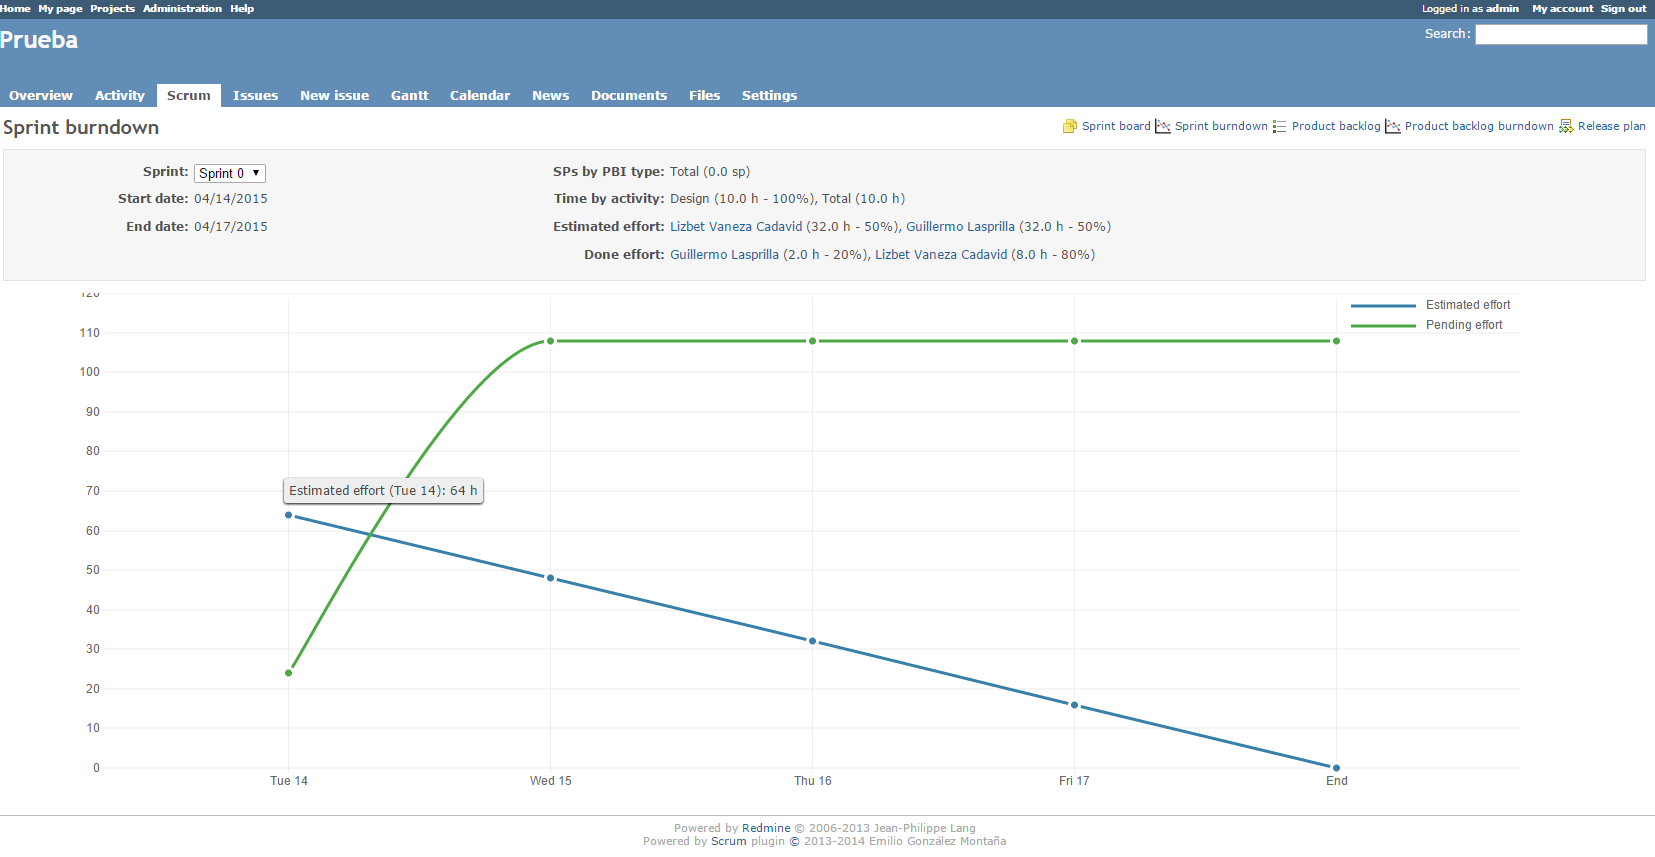
The estimated effort as you can see in image RM2 is ok cause it added both estimated effort of both developers 32 + 32 = 64 estimated effort.
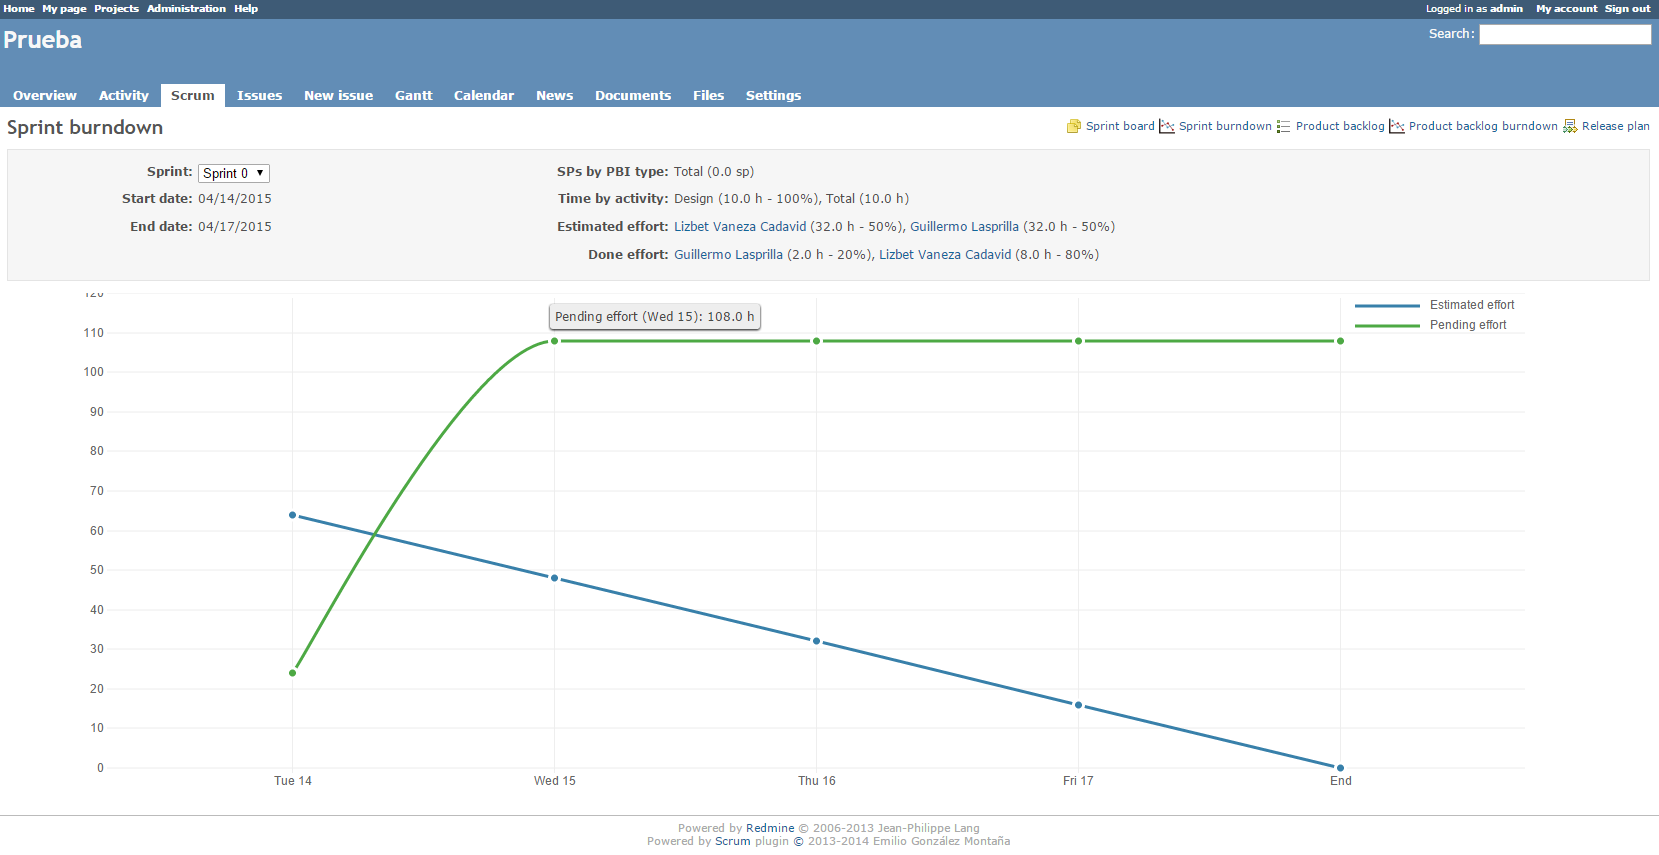
But the pending effort line (green one) in image RM3 shows 108 hours.
I think thats wrong should not be 108 hours.
Are experiencing something like this?
Any work around to solve this issue?
thank you.
Replies (1)
 RE: Sprint BurnDown chart
-
Added by Emilio González Montaña about 11 years ago
RE: Sprint BurnDown chart
-
Added by Emilio González Montaña about 11 years ago
Try to list all task issues in issues tab, filtering by the Sprint. The idea is that maybe there are more tasks (with more pending effort), maybe because they are rejected (or parent PBIs are rejected) but still counting on burndown graph. Why do you have a negative pending effort in one of the tasks?